Gene and protein expression in adult haematopoiesis
Single-Cell Gene Expression Atlas
Overview
Maintenance of the blood system requires balanced cell fate decisions of haematopoietic stem and progenitor cells (HSPCs). Since cell fate choices are executed at the level of individual cells, new single cell profiling technologies offer exciting possibilities to map the dynamic molecular changes underlying HSPC differentiation.
We have used single cell RNA-Seq combined with index sorting to profile 1,656 single HSPCs, where deep sequencing enabled us to detect an average of 6,558 protein-coding genes per cell. The use of broad sorting gates allowed us to retrospectively assign cells to 12 standard populations. Here we present an intuitive web interface as a new community resource, to permit visualization of gene expression in HSPCs at single cell resolution for any gene of choice. To facilitate more advanced datamining, we also provide download links for the full expression data matrix.
Data
Nestorowa et al., 2016
The data on this website is described in the paper by Nestorowa et al., Blood, 2016.
Download matrix of normalised gene counts and flow cytometry protein levels here. The first column contains the cell name, the next 3 columns contain the diffusion map coordinates where the cell is located; the following 10 columns contain flow cytometry data of 9 cell-surface markers and FSC-H; the rest of the columns contain gene expression data labelled with ensembl gene IDs. If you would like to locate a particular cell in the diffusion map, introduce the cell name here.
To find cell type identity download the cell type matrix here. Cell names match the above matrices, and the cell types are given for both the broad and narrow cell type categories that were retrospectively identified using the index data. An entry of "1" in the table indicates a cell belongs to the cell type category, whereas a "0" means it does not. Due to the presence of both narrow and broad gates in the table, along with cell types that are subsets of other cell types (e.g. MPP1 and MPP), cells can belong to multiple categories.
Note: Data previously downloaded from this website (prior to 26 October 2017) contained 28 cells with the incorrect gene expression counts. These data have now been corrected and the corresponding diffusion map visualisations updated.
Wolf et al., 2017
More recent analysis of these data using approximate graph abstraction is described our pre-print Wolf et al., bioRxiv, 2017. This analysis is described in this example notebook and the necessary data for reproducing this analysis can be downloaded clicking these links:
Visualisation of gene expression
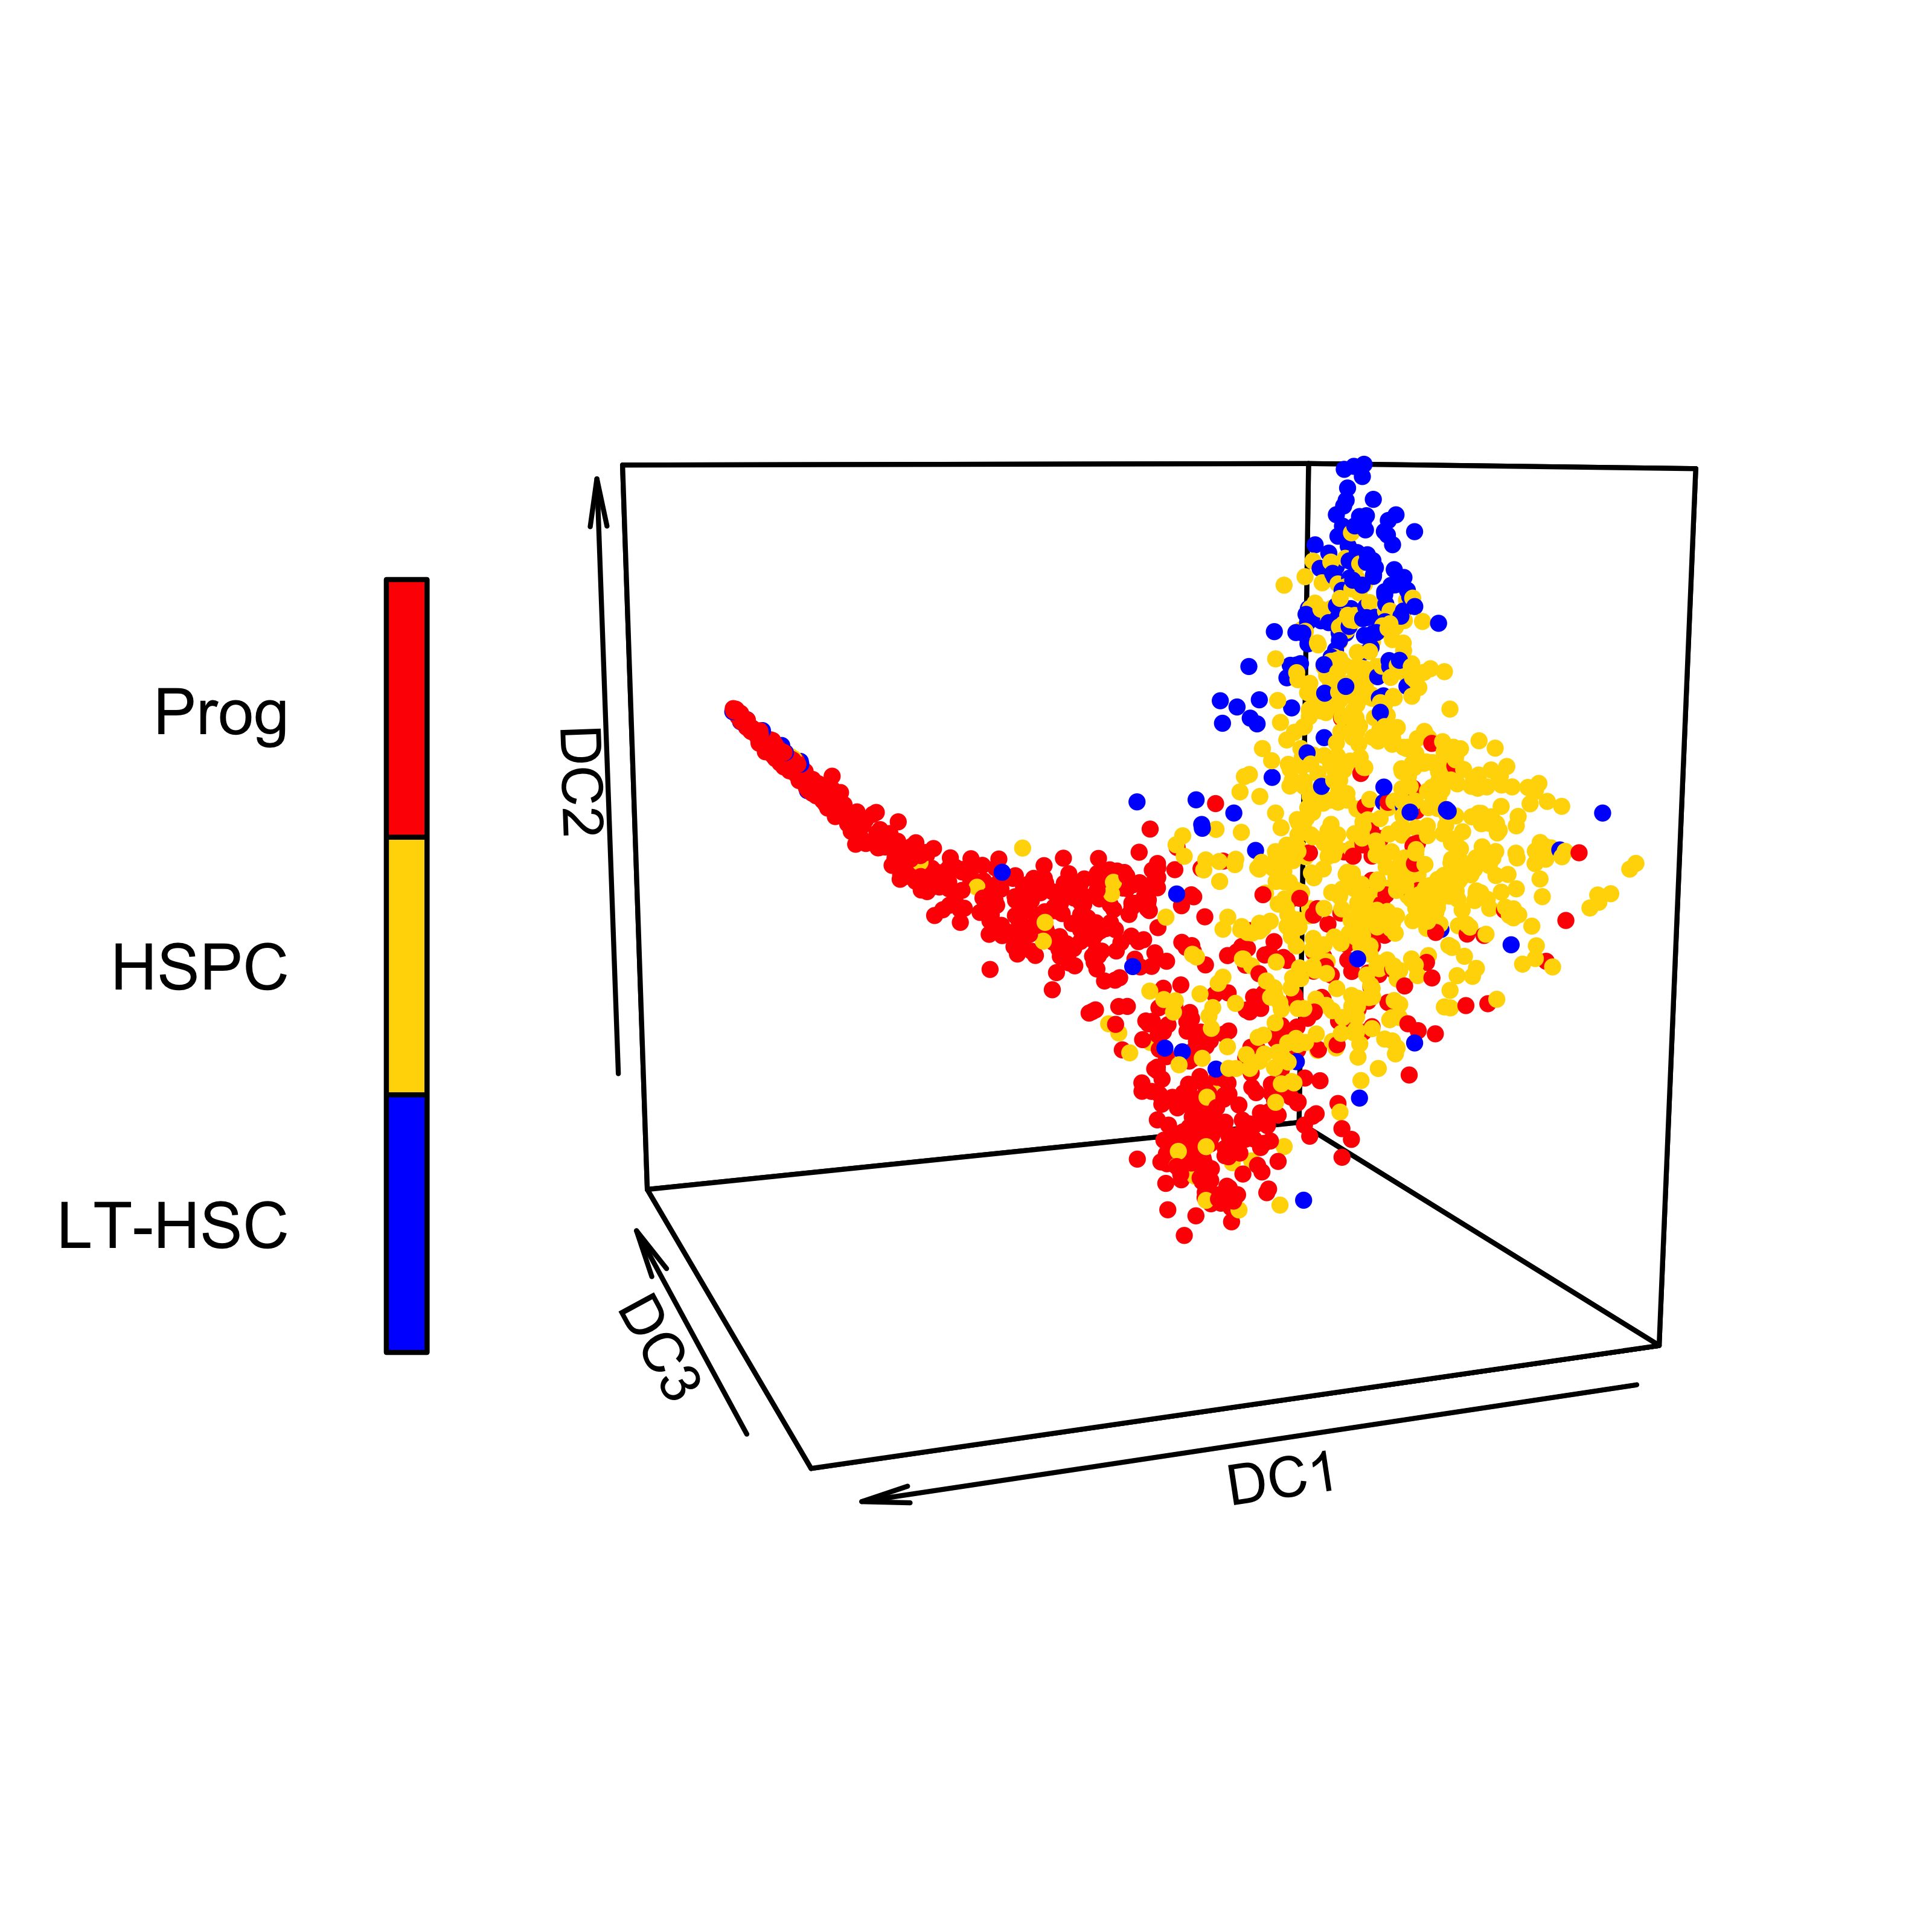
Gating strategy
Cells from adult mouse bone marrow were captured in three gates for single-cell RNA-Seq:
- Prog (Lin- Sca1- c-Kit+).
- HSPC (Lin- Sca1+ c-Kit+).
- LT-HSC (Lin– c-Kit+ Sca1+ CD34– Flk2–).
Visualisation of flow cytometry data
Click on each one to explore the 3 dimensions interactively!
 |
 |
 |
 |
 |
 |
 |
 |
Visualisation of cell types
Click on each one to explore the 3 dimensions interactively!
 |
 |
 |
 |
 |
 |
 |
 |
 |
 |
 |
 |
Projection demonstration
Included is a demonstration of how to project data on to the diffusion map. The normalised counts for the 4,773 variable genes can be downloaded here. Demonstration expression data for projection from (Grover et al., Nature communications, 2016) can be downloaded here.
